
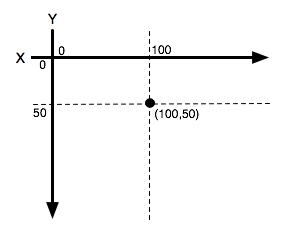
With HTML5, using tag <canvas>, it is possible create a graph bar without third part software. The first thing to do is write some functions in JavaScript. Before you copy code, you have to understand the coordinates on Canvas. The next figure show how coordinates are designed. It is not the same of what we learned on Math classes.
JavaScript code:
| <script type="text/javascript"> function drawLine(context,startX,startY,endX,endY,color){ context.beginPath(); context.moveTo(startX,startY); context.lineTo(endX,endY); context.closePath(); context.strokeStyle=color; context.stroke(); } function drawRectangle(context,startX,startY,width,height,fill){ context.beginPath(); context.rect(startX,startY,width,height); context.closePath(); context.stroke(); if(fill) context.fill(); } function clearCanvas(context){ // Store the current transformation matrix context.save(); // Use the identity matrix while clearing the canvas context.setTransform(1, 0, 0, 1, 0, 0); context.clearRect(0, 0, myCanvas.width, myCanvas.height); // Restore the transform context.restore(); } function drawBarChart(context,data,startX,startY,endX, endY,chartHeight,barWidth,markDataIncrementsIn,scale){ //draw x-axis drawLine(context,startX,startY,endX,startY,"#000"); //draw y-axis drawLine(context,startX,startY,startX,endY,"#000"); var maxValue=0; for(var i=0;i<data.length;i++){ //extract data var values = data[i].split(","); //column name var name=values[0]; //column value var height=parseFloat(values[1])*scale; //find maximum value if(parseInt(height)>parseInt(maxValue)) maxValue=height; //write data to chart //fill rectangle with yellow color context.fillStyle="#ff0"; drawRectangle(context,startX+(i*barWidth*2),(startY-height),barWidth,height,true); //add column title to x-axis context.textAlign="left"; //text color is black context.fillStyle="#000"; context.fillText(name,startX+(i*barWidth*2),(chartHeight-25),barWidth*2); } //add some data markers to y-axis var numMarkers = Math.ceil(maxValue/parseInt(markDataIncrementsIn)); context.textAlign="right"; context.fillStyle="#000"; var markerValue=0; for(var i=0;i<=numMarkers;i++){ context.fillText((markerValue/parseInt(scale)),(startX-5),(startY-markerValue),50); if(i==0){ drawLine(context,startX,(startY-markerValue),endX,(startY-markerValue),"#000"); }else{ drawLine(context,startX,(startY-markerValue),endX,(startY-markerValue),"#00f"); } markerValue+=parseInt(markDataIncrementsIn); } } function graph(scale){ var s=0; var changed=false; document.getElementById("range").innerHTML=scale; if(scale==undefined){ s=1; changed=false; }else{ s=scale; changed=true; } var graphCanvas = document.getElementById("myCanvas"); //ensure that element is available within DOM if(graphCanvas && graphCanvas.getContext){ //open a 2d context within canvas var context = graphCanvas.getContext("2d"); //bar chart data var data = new Array(5); data[0]="Bad,2"; data[1]="Mediocre,0.45"; data[2]="Sufficient,5.5"; data[3]="Good,7.2"; data[4]="Excelent,3.9"; //draw bar chart if(!changed){ drawBarChart(context,data,35,560,750,50,myCanvas.height,30,s,s); }else{ //clear canvas to redrawing clearCanvas(context); //draw bar chart drawBarChart(context,data,35,560,750,50,myCanvas.height,30,s,s); } } return true; } </script> |
The second thing to do is write some HTML tags.
| <body onload="graph(1);"> <div id="title">Grades</div> <table> <tr> <td><canvas id="myCanvas" width="800" height="600"></canvas><td> <td> <table> <tr> <td>Scale : <span id="range">1</span></td> </tr> <tr> <td><input type="range" min="1" max="501" value="1" onchange="return graph(this.value)"/></td> </tr> </table> </td> </tr> </table> </body> |
The third thing to do is write CSS.
| <style type="text/css"> #title{ text-align: center; } </style> |
Now put together all three parts on a single page or you can create a file to JavaScript and another to CSS and then link them on HTML page. How you can do that? Copy the next code and you can change name files.
| <head> <link rel="stylesheet" type="text/css" href="style.css" /> <script type="text/javascript" src="functions.js"></script> </head> |
Attention
All this code is working on Google Chrome. Also works on Safari and Opera. If you will use Internet Explorer, you will have problems. For example, you can not use slide bar and you have to type a value instead.